

Dartboard Density
This is one of those projects that took far longer than I thought it would. But a few episodes of Peep Show into editing with Paint.net I was rather locked in. I thought it would be interesting to divide the number of points for each section of the board. Notice that this isn't a metric that tells you where you should be aiming. Two points on that: firstly we would want to metric that rewarded both points and easy to hit-ness, so points*area would be the thing to go for, and secondly, this amazing article by Data Genetics has already extended past that basic concept and done so much more. TLDR; you should probably be aiming for the triple 19.
Instead, my metric imagines the dartboard as a land of plentiful goods, where each region has a certain number of riches spread out among its citizens. I wanted to know the richest. This won't help you play darts at all, but it was a fun exercise in visualisation.
To work out the area we need some dimensions and thankfully dartboards are standardised:

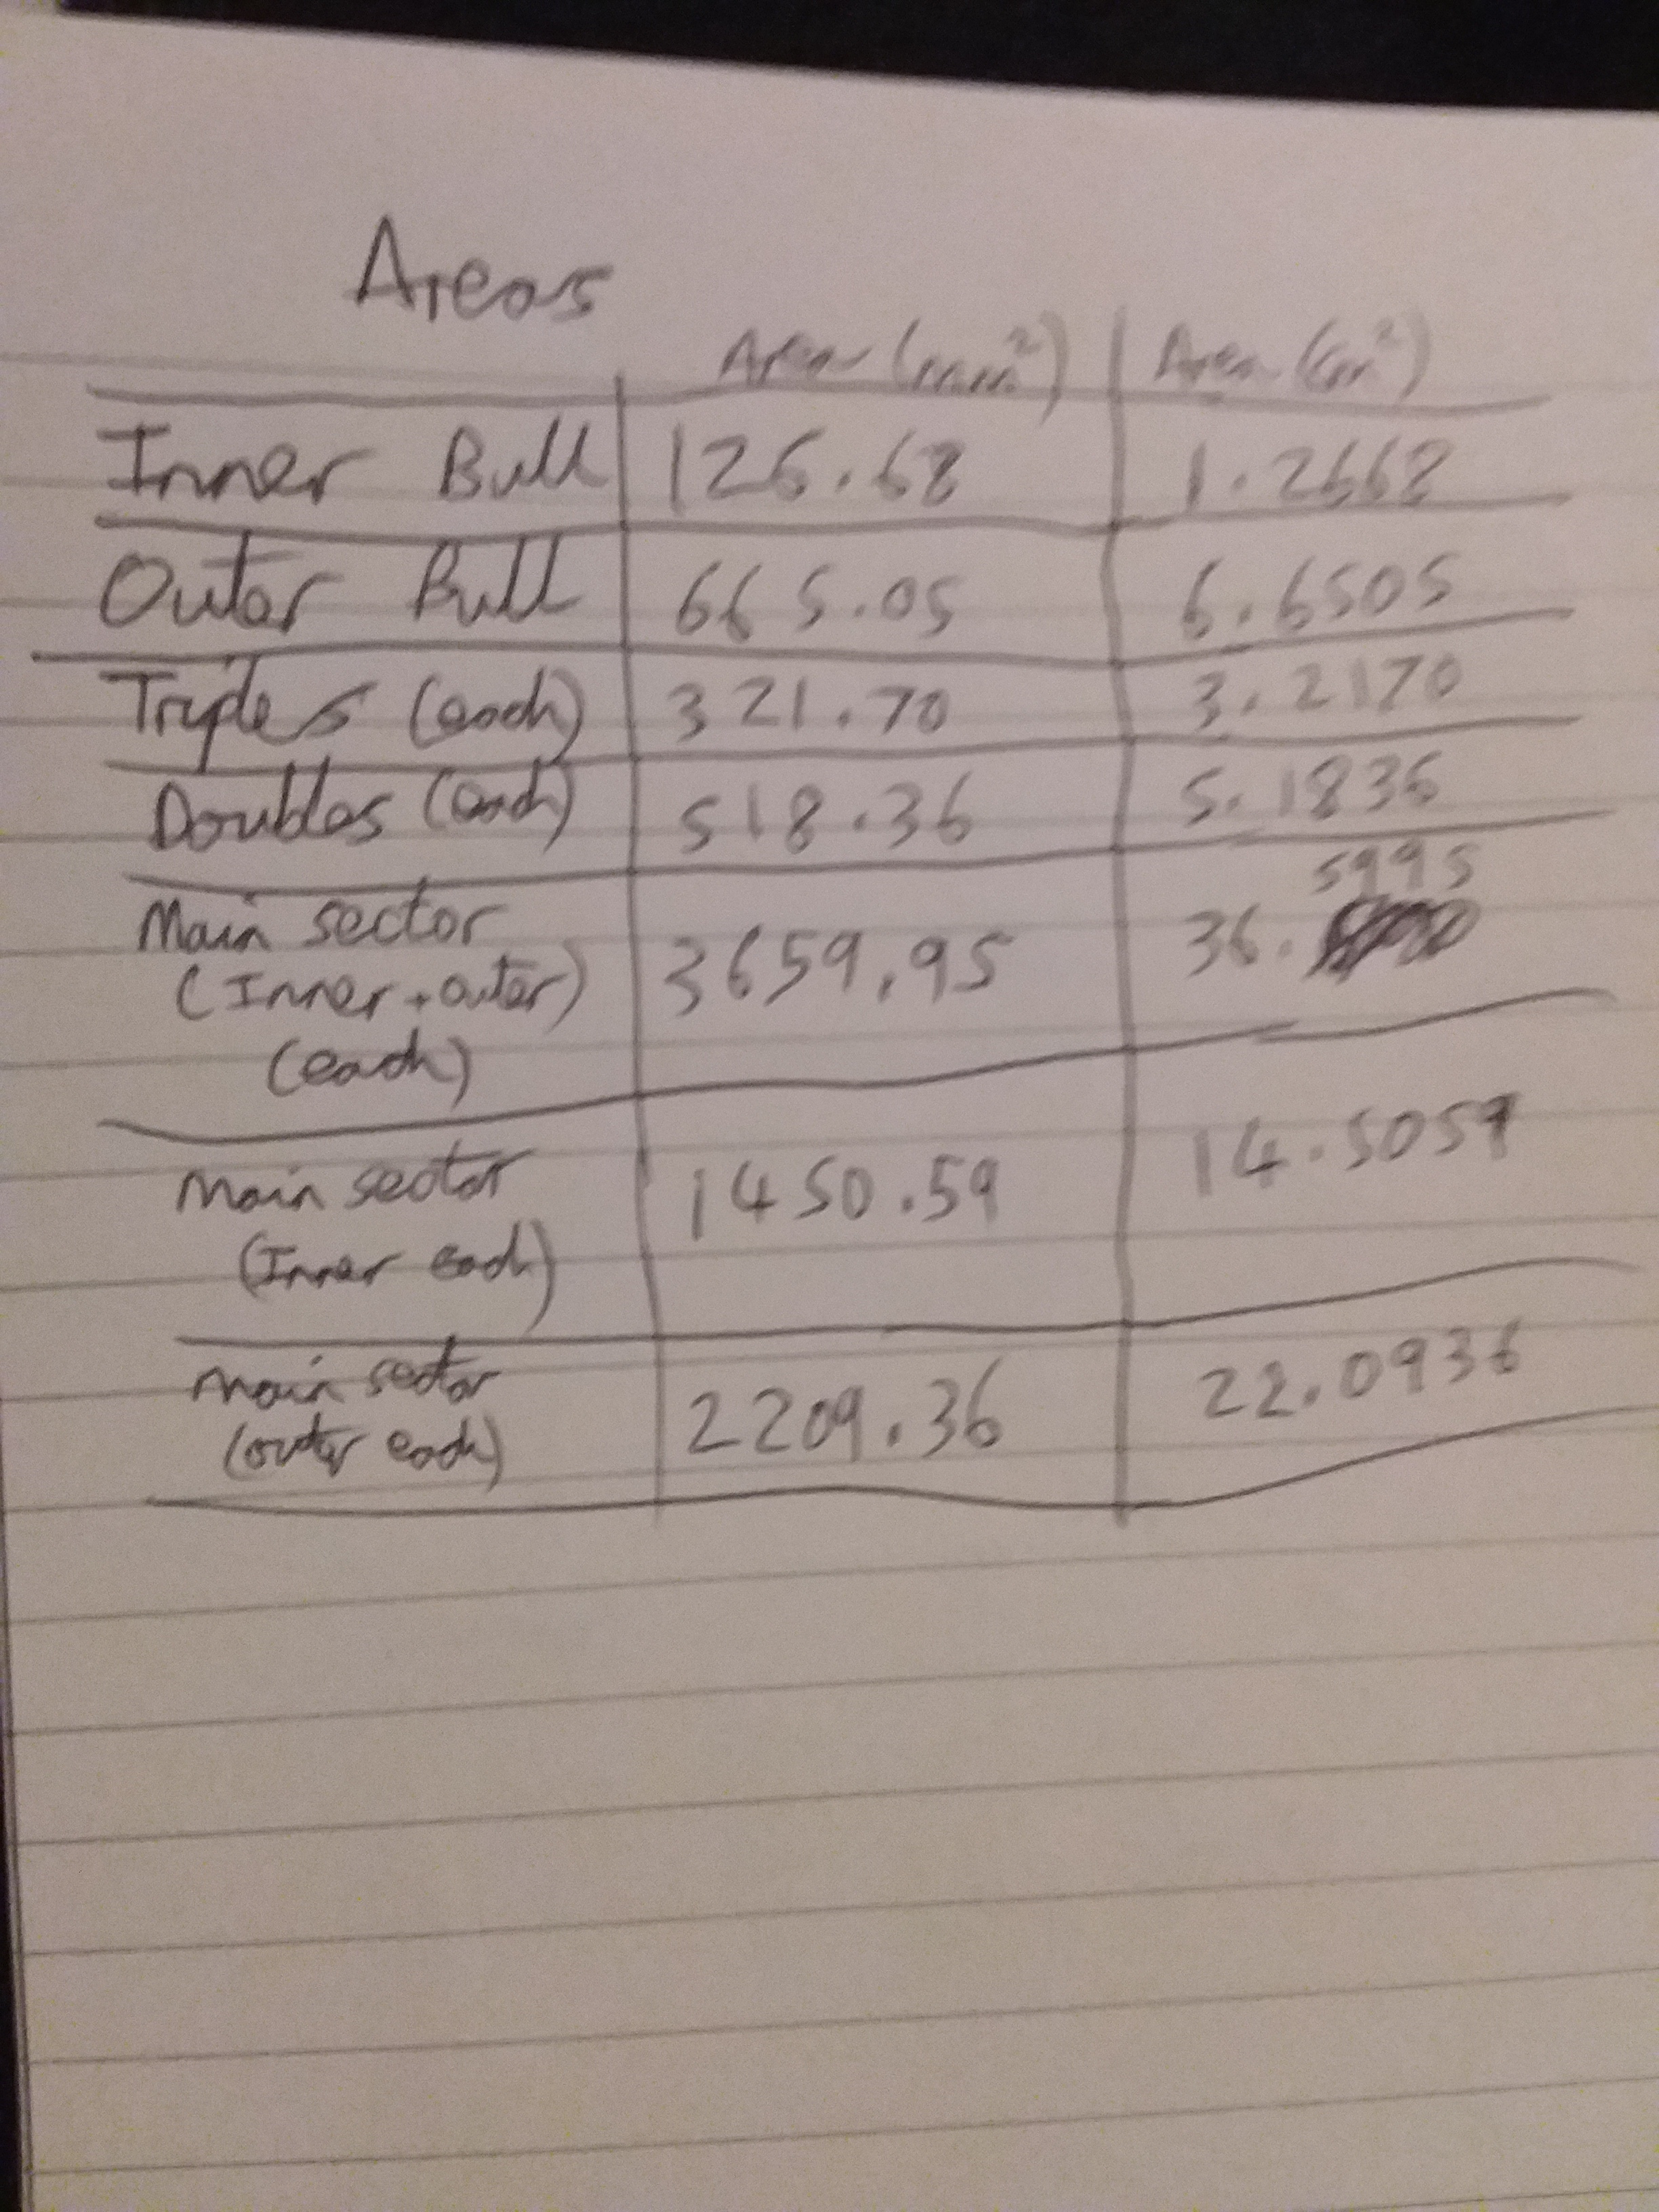
Here are the areas as a table:
That lets us produce a coloured chart of points per area. I put a sliding scale from 255 red 0 green for the highest scoring (the inner bull) and 0 red 255 green for the lowest points (single 1). As you can see, the Inner Bull is a complete outlier.

For some of the raw numbers see below. There is an error explained below it.

There is an error in this diagram. The double and triple rings haven't been doubled and triples yet.


